Stay in the loop
Get weekly tips and resources to help you build and launch faster.
GraphQL Network Inspector Docs
Introduction
GraphQL Network Inspector is an open-source tool that helps you to inspect the network traffic between your GraphQL client and server. It provides a visual representation of the GraphQL network requests and responses, which makes it easier to debug and optimize your GraphQL queries.
What it doesn't do
-
GraphQL Network Inspector is not a replacement for the browser's network tab or other network monitoring tools. It is specifically designed for inspecting GraphQL network traffic and does not provide general network monitoring features.
-
GraphQL Network Inspector is not a proxy. We only capture the network traffic between your GraphQL client and server, and we do not modify or intercept the requests in any way.
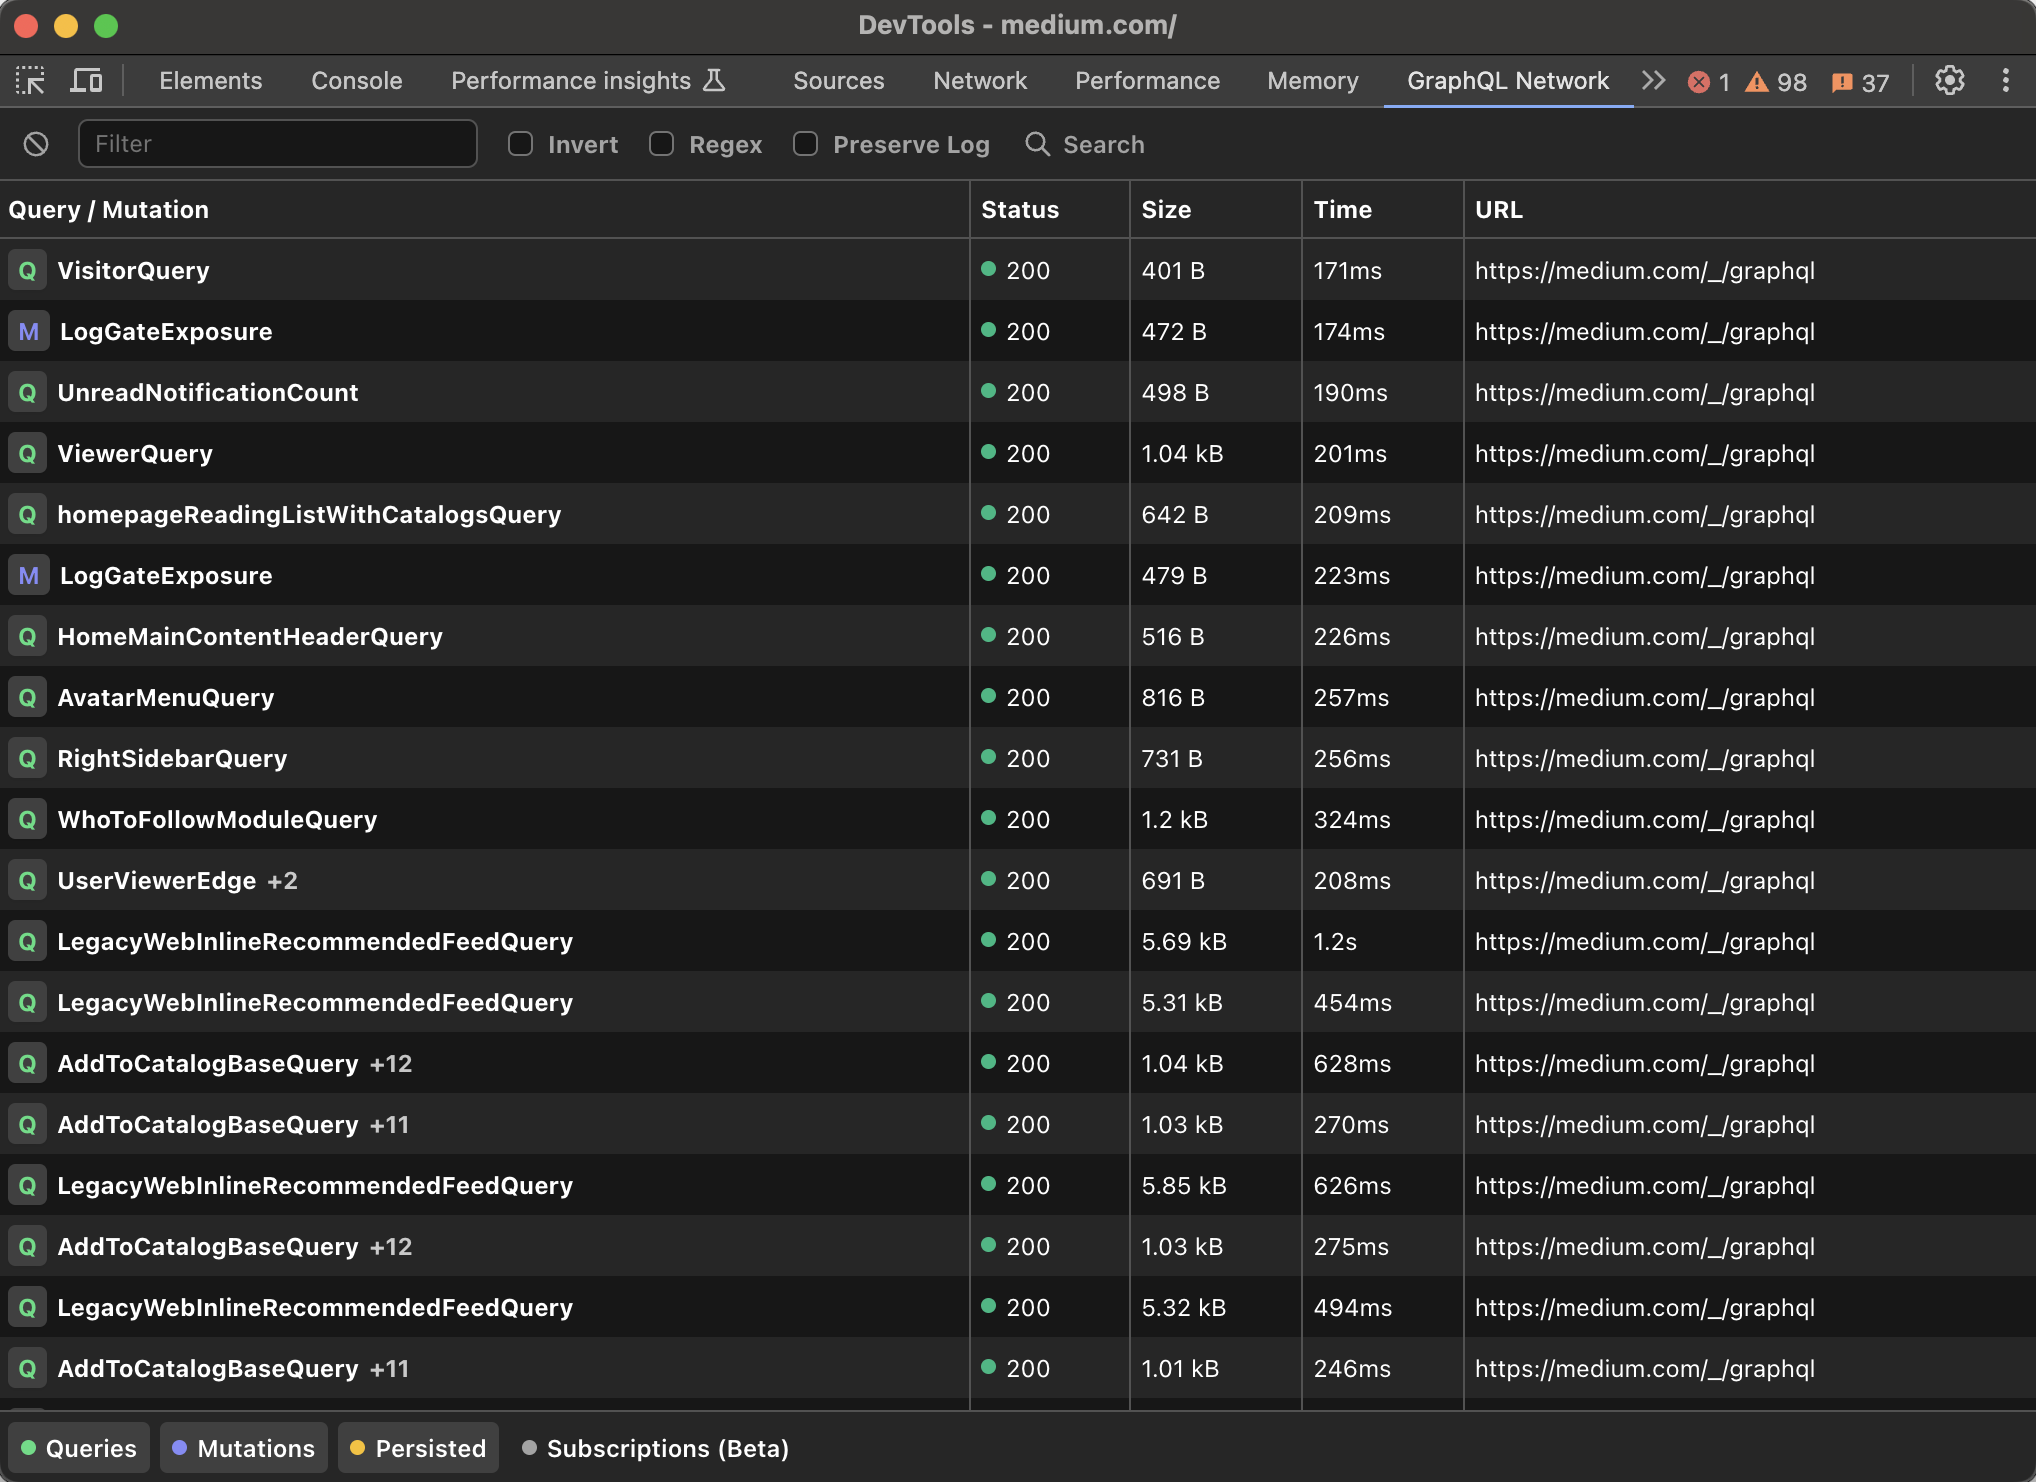
Getting started
To get started with GraphQL Network Inspector, install the extension then click the new "GraphQL Network" tab developer tools. The extension is available for Chrome and Firefox browsers.
Installation
-
Chrome: Install the Chrome extension
-
Firefox: Install the Firefox extension
Inspecting network traffic
We'll capture traffic send through both GET and POST but request must align with the GraphQL spec. At minimun that's a payload with query containing valid GraphQL query syntax.
{
  "query": "query { users { id } }"
}
View requests
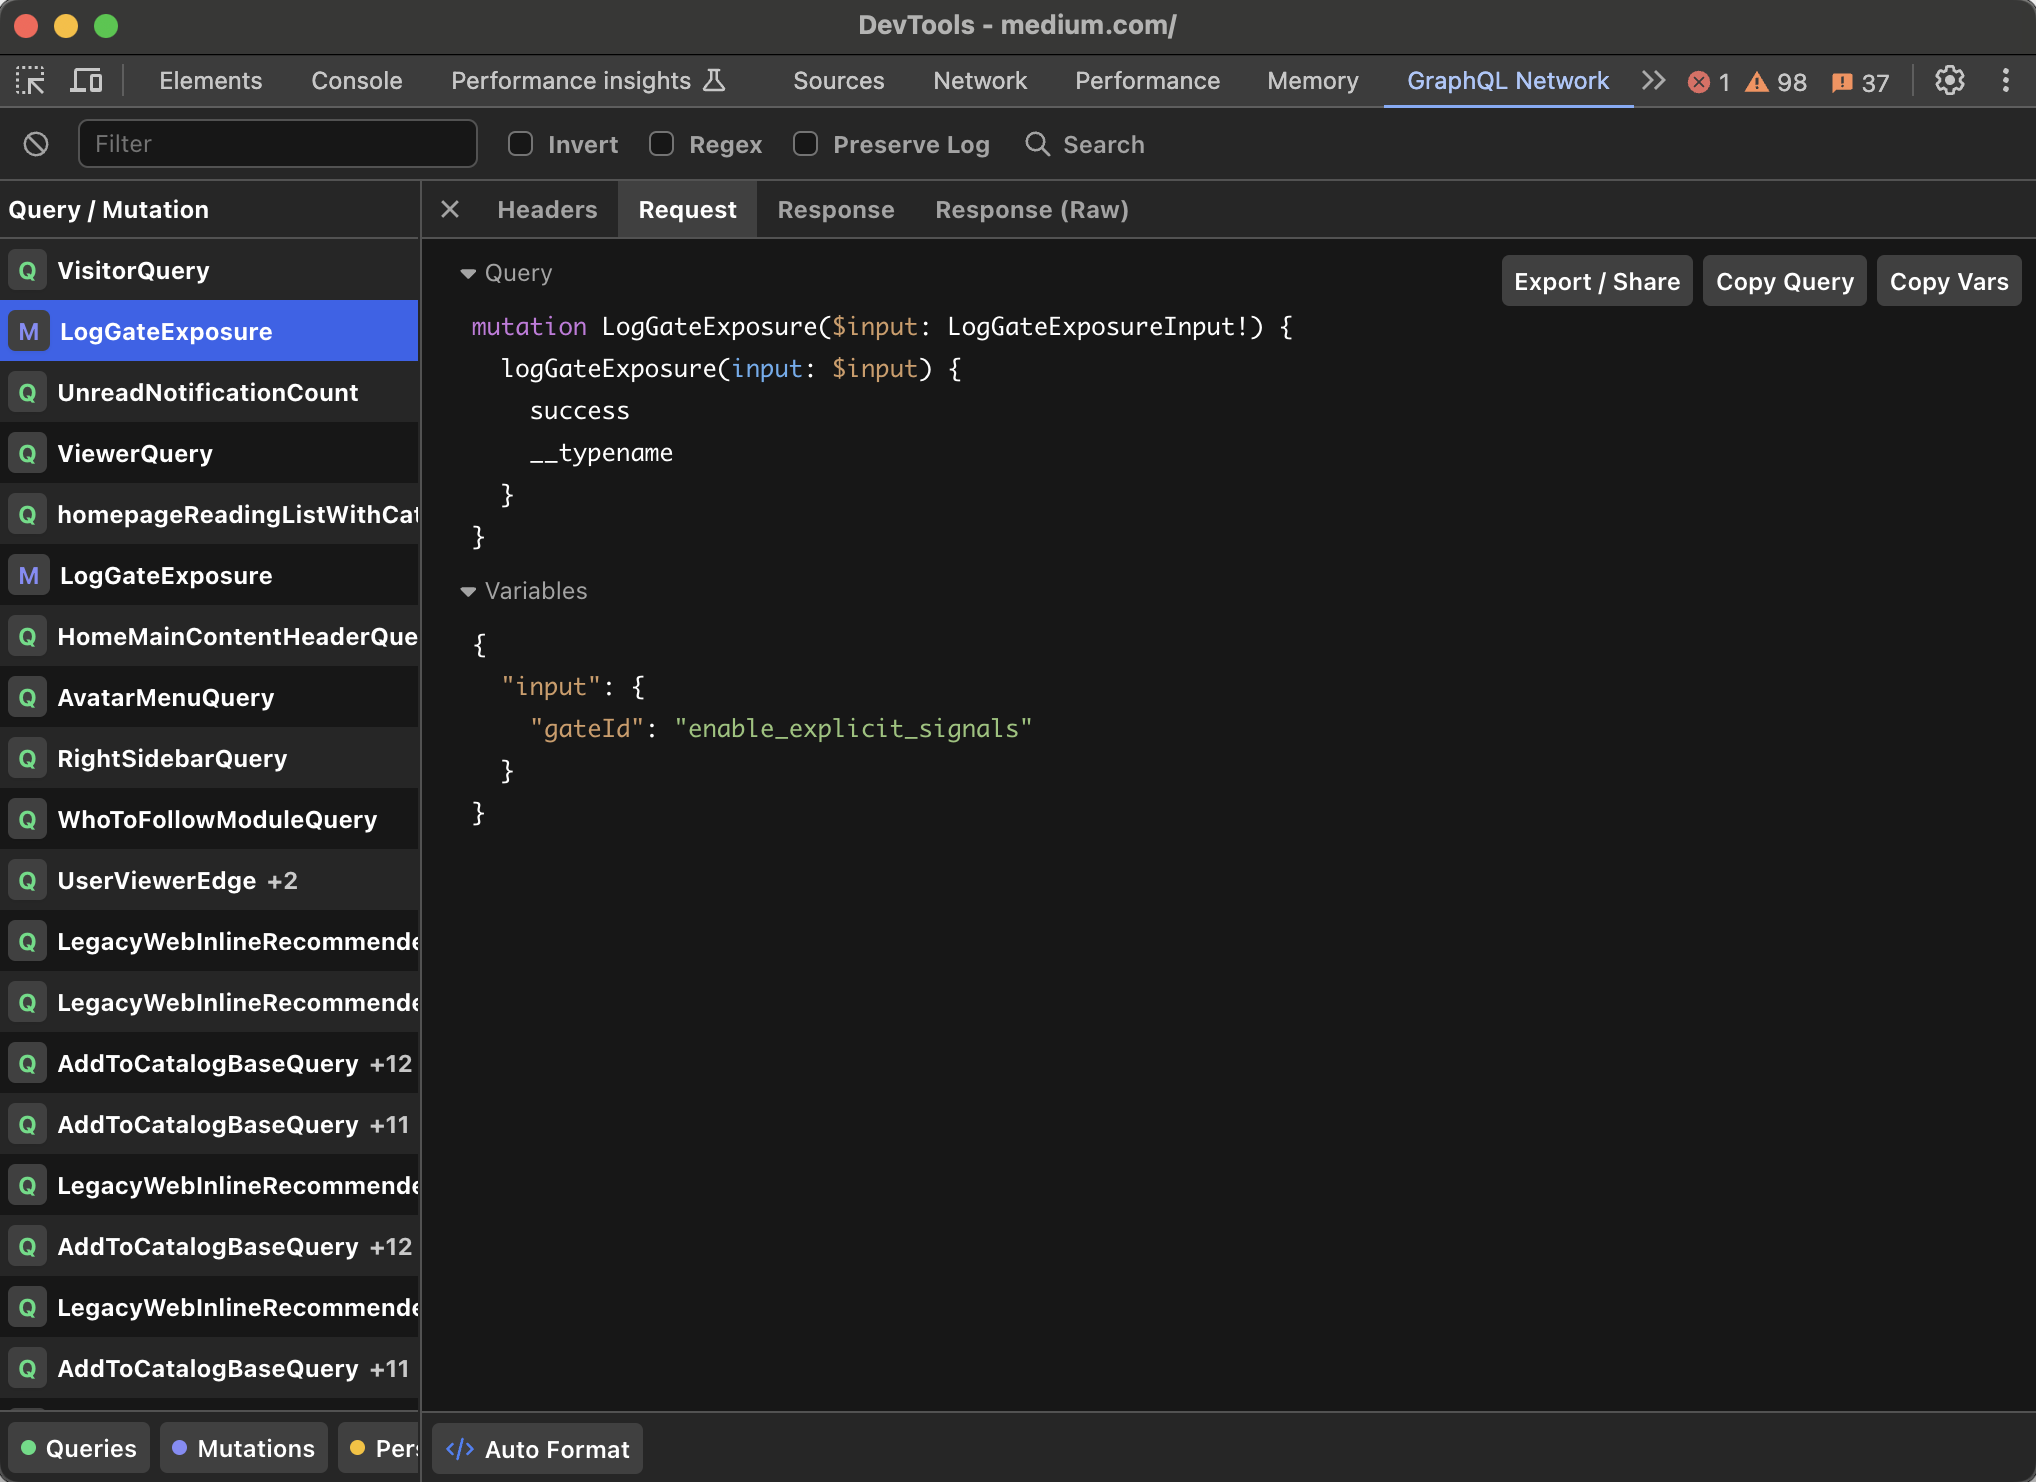
We'll parse and display all requests using the name of the first query in the payload. (Query batching is also supported). Each request will include the graphql query and variables.
View responses
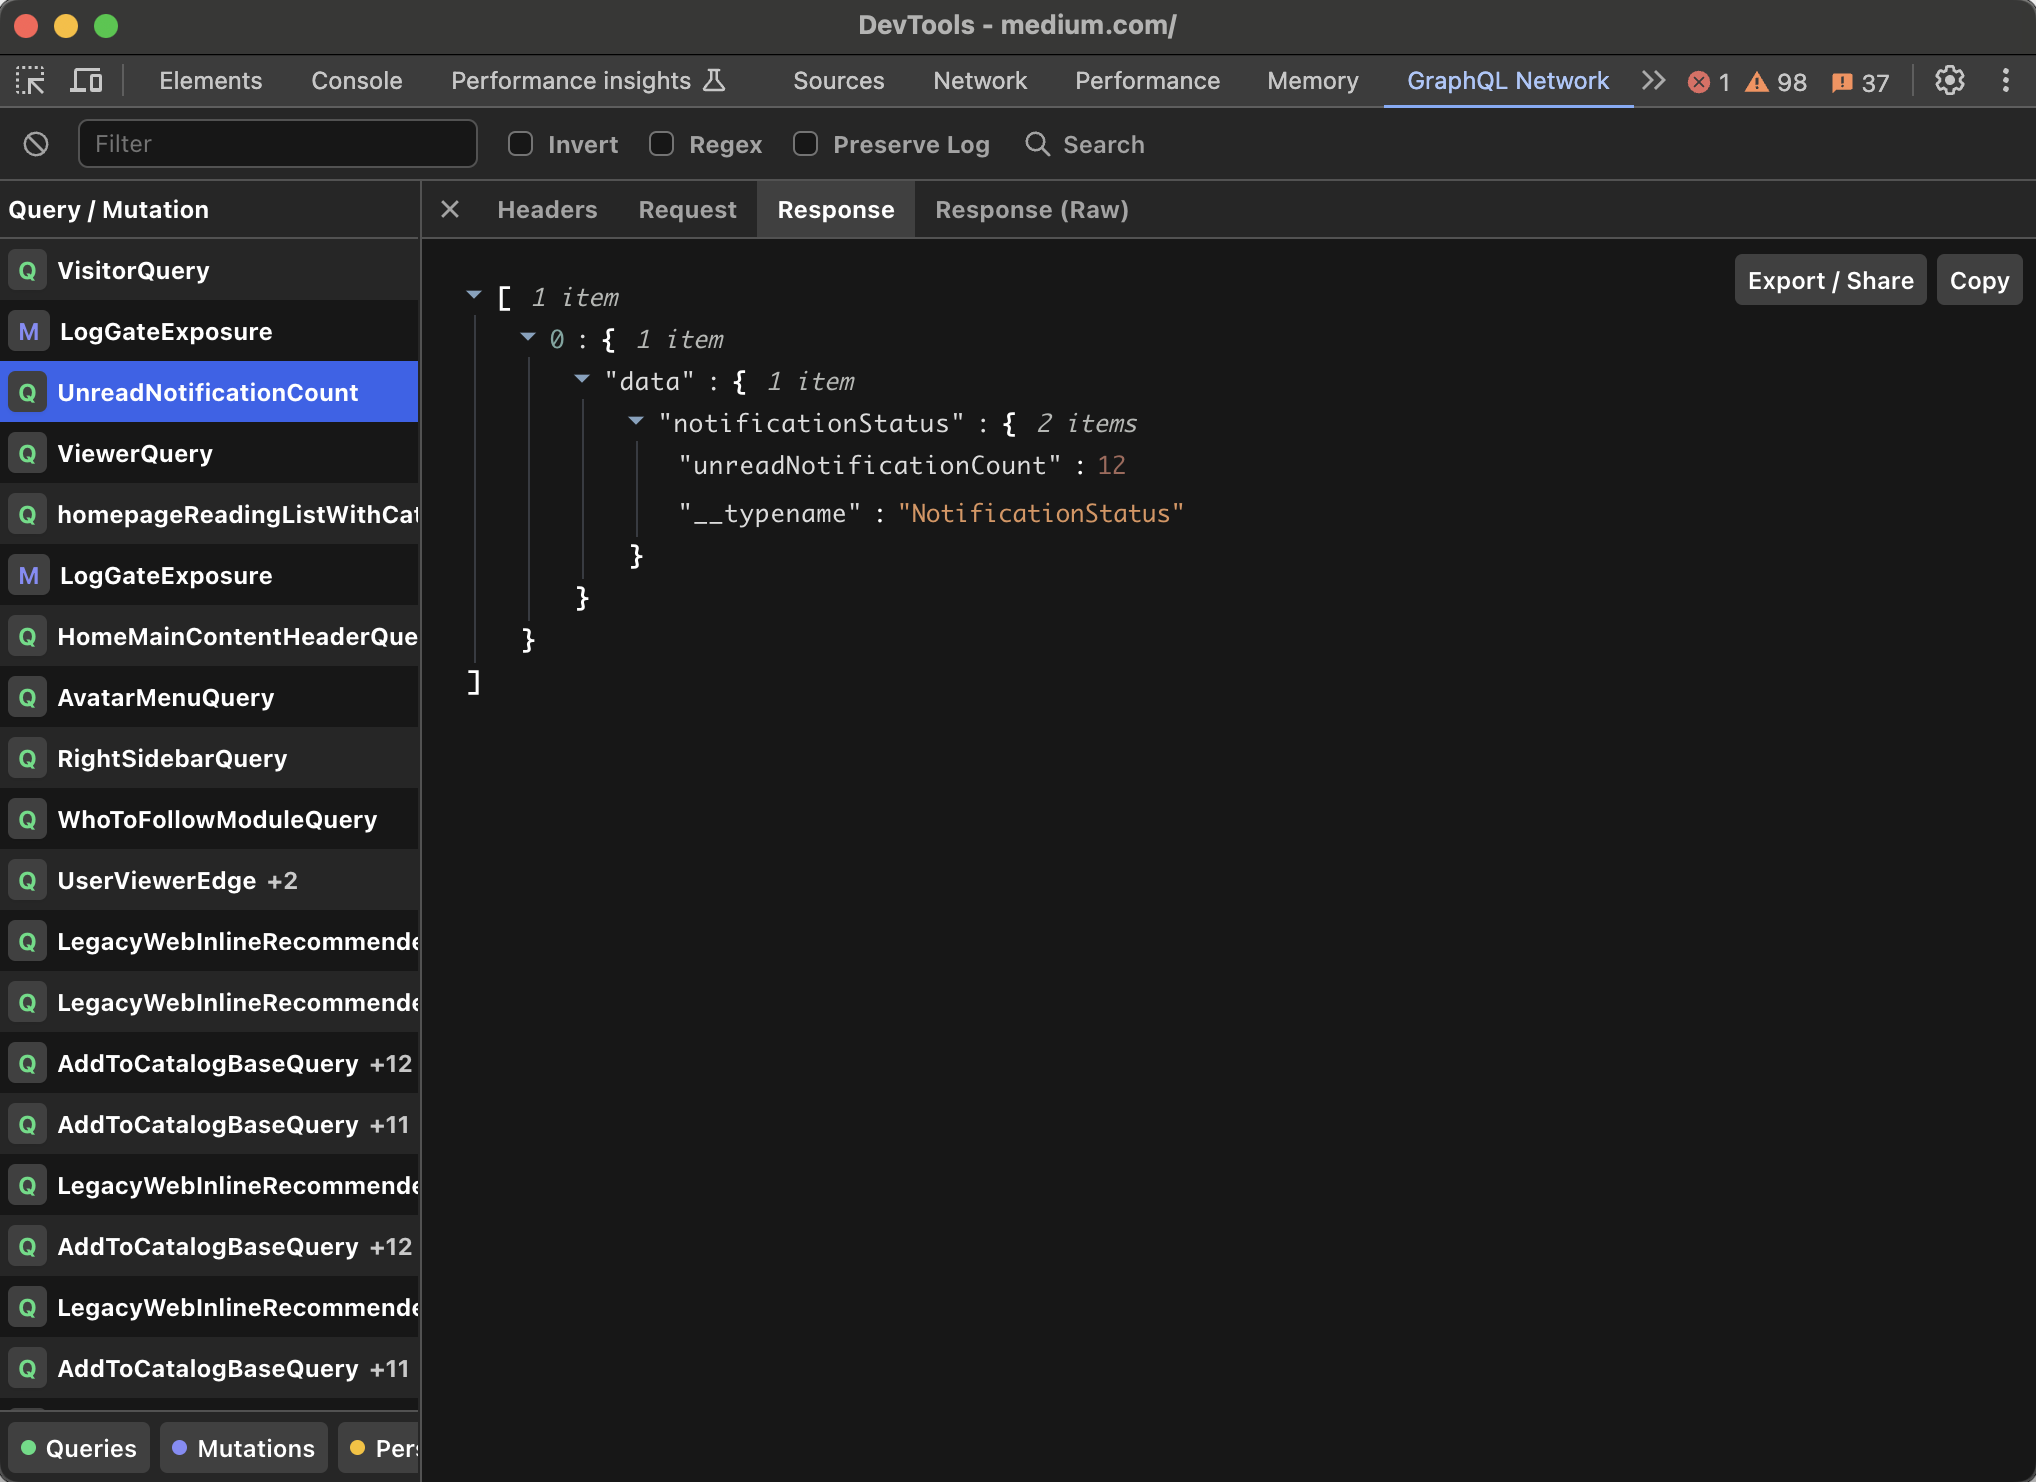
Responses are displayed as JSON, you can either view the collapsed view which can be expanded per block, or just see raw JSON under the "Response (Raw)" tab.
View headers
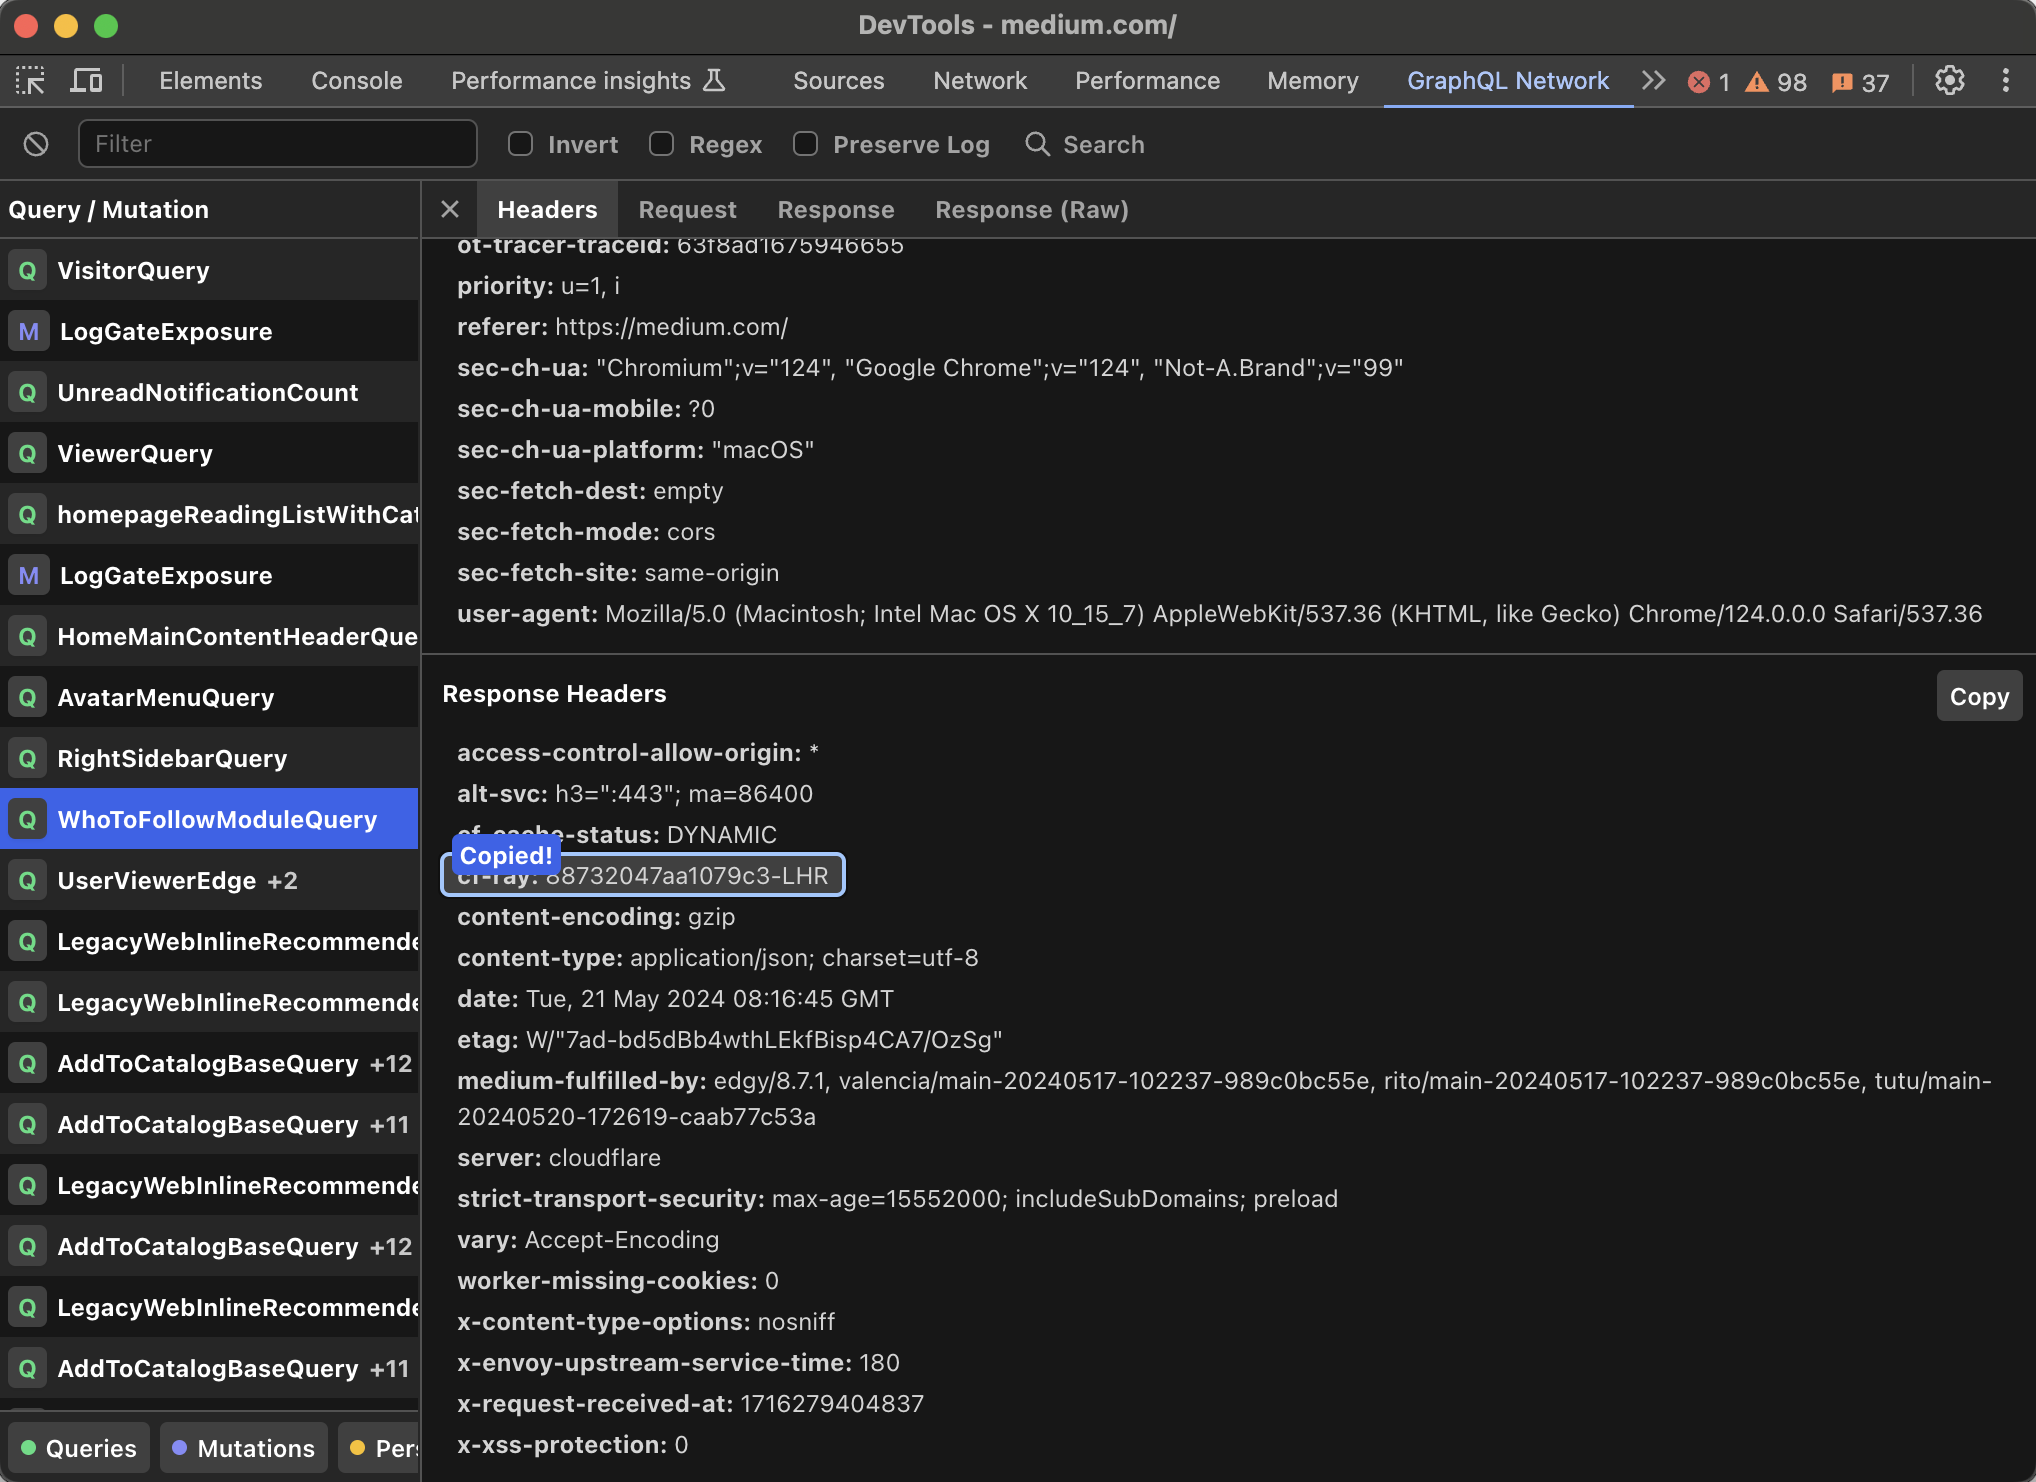
Headers are displayed in a simple list view, this panel shows both request and response headers.
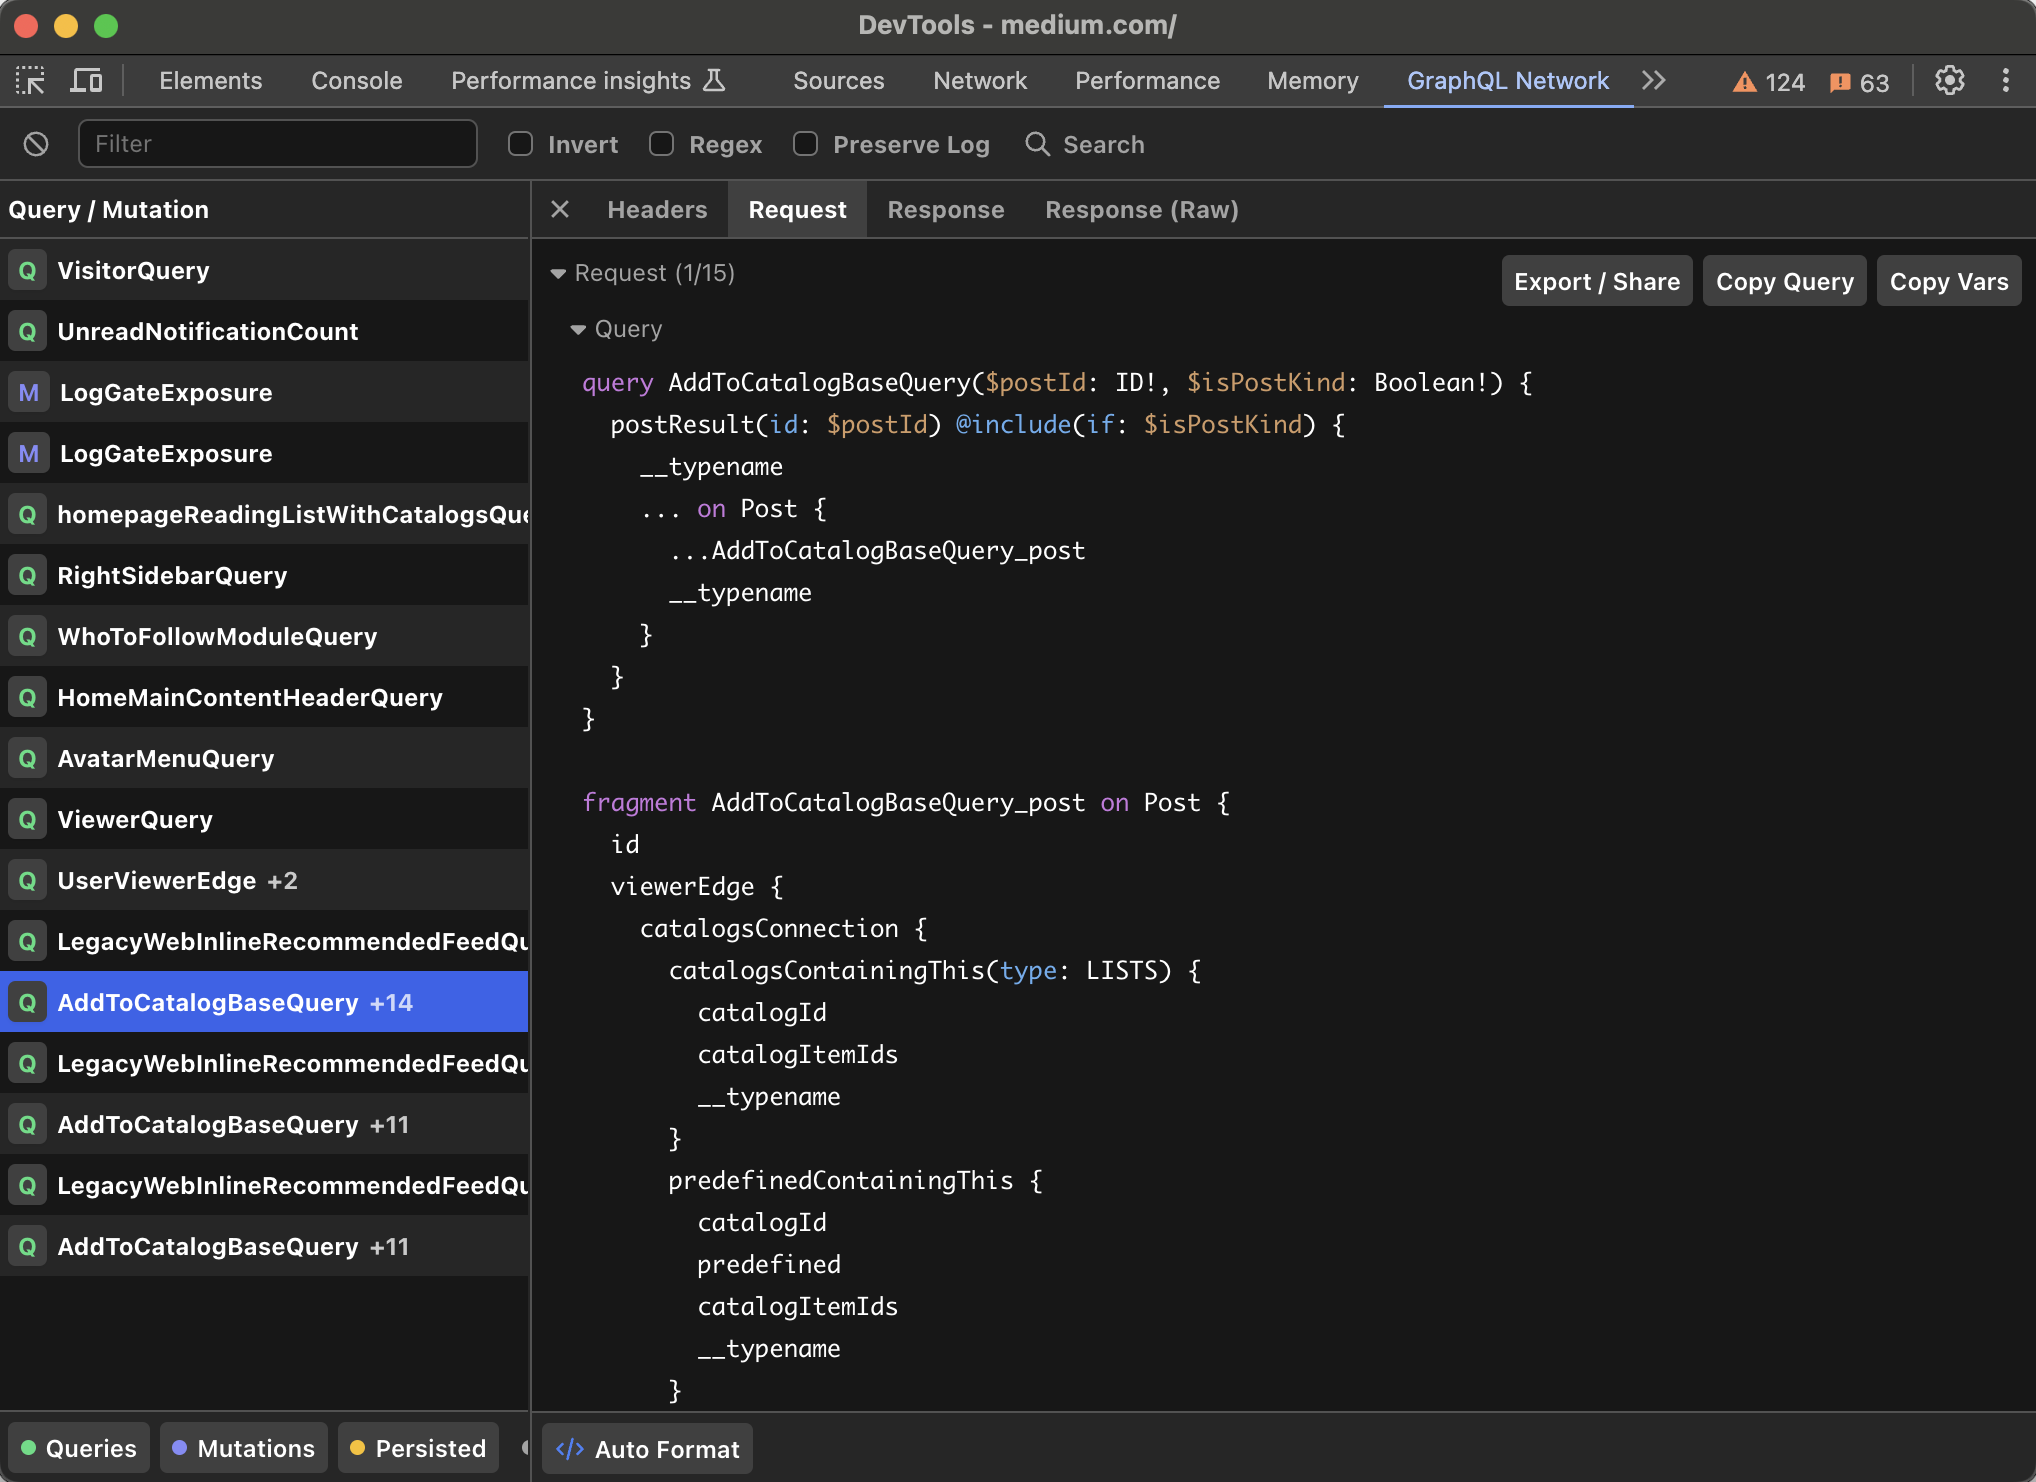
Viewing batched requests
If your GraphQL client is sending batched requests, they'll all be visible within the request and response panels. The query list will show a +n indicating how many queries are included in addition to the first query.
Viewing subscriptions
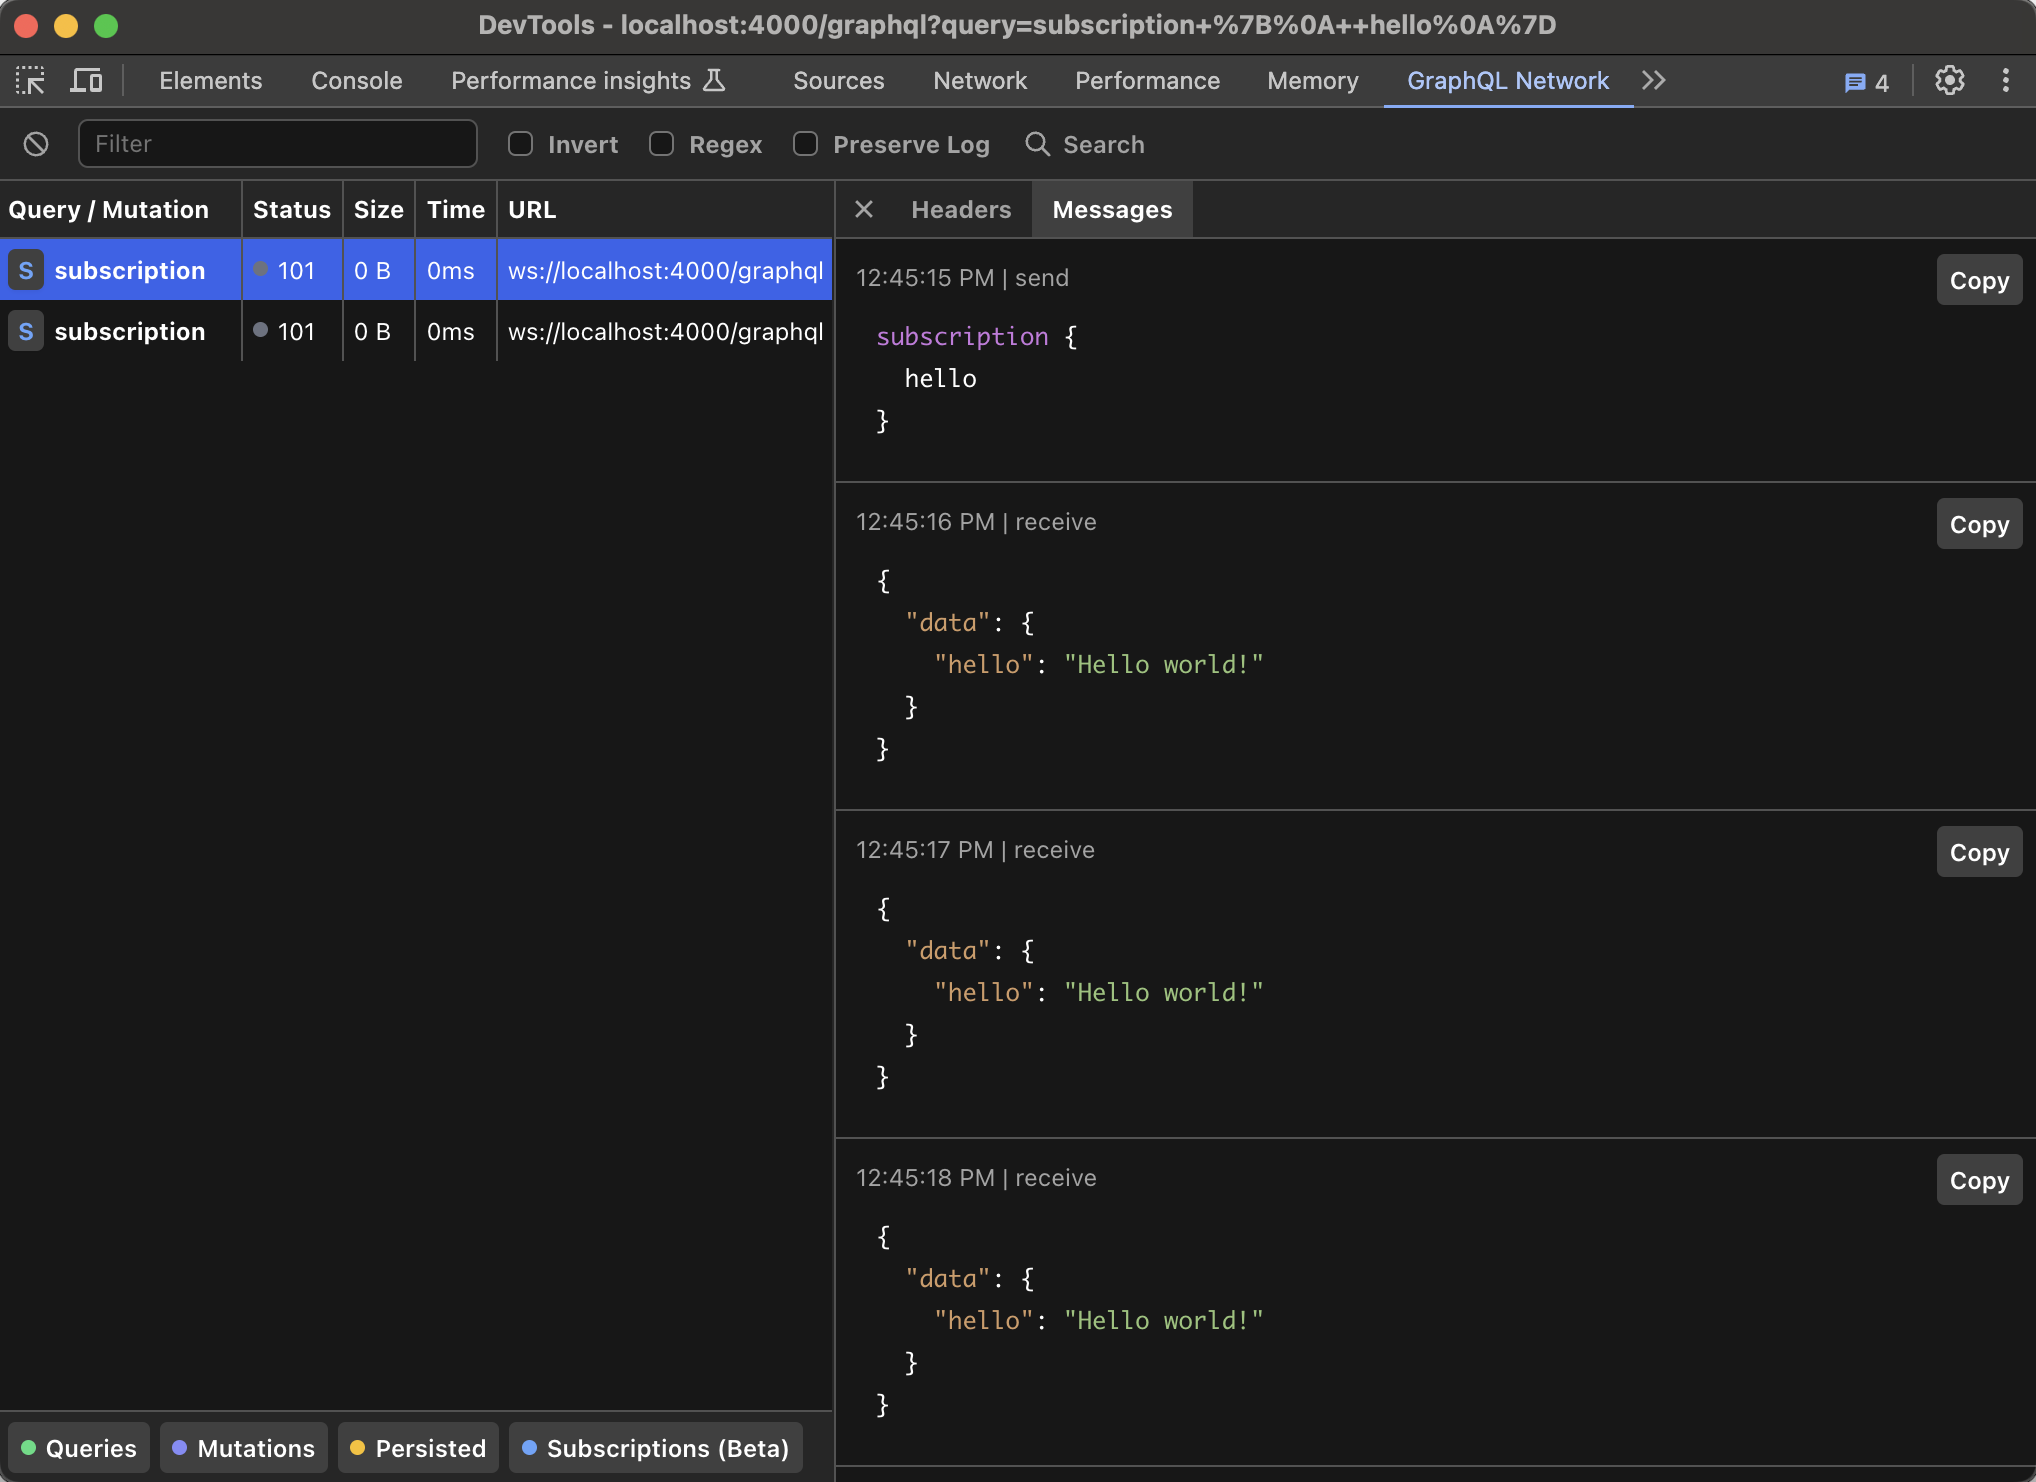
Initial support for subscriptions has been added, these are disabled by default as we need to poll the HAR log to access the data. Click "Subscriptions" in the footer to display them.
Currently we only support subscriptions via websockets sent to an endpoint ending in /graphql for example ws://my-api.com/graphql
We'll extend support depending on user demand.
Filtering requests
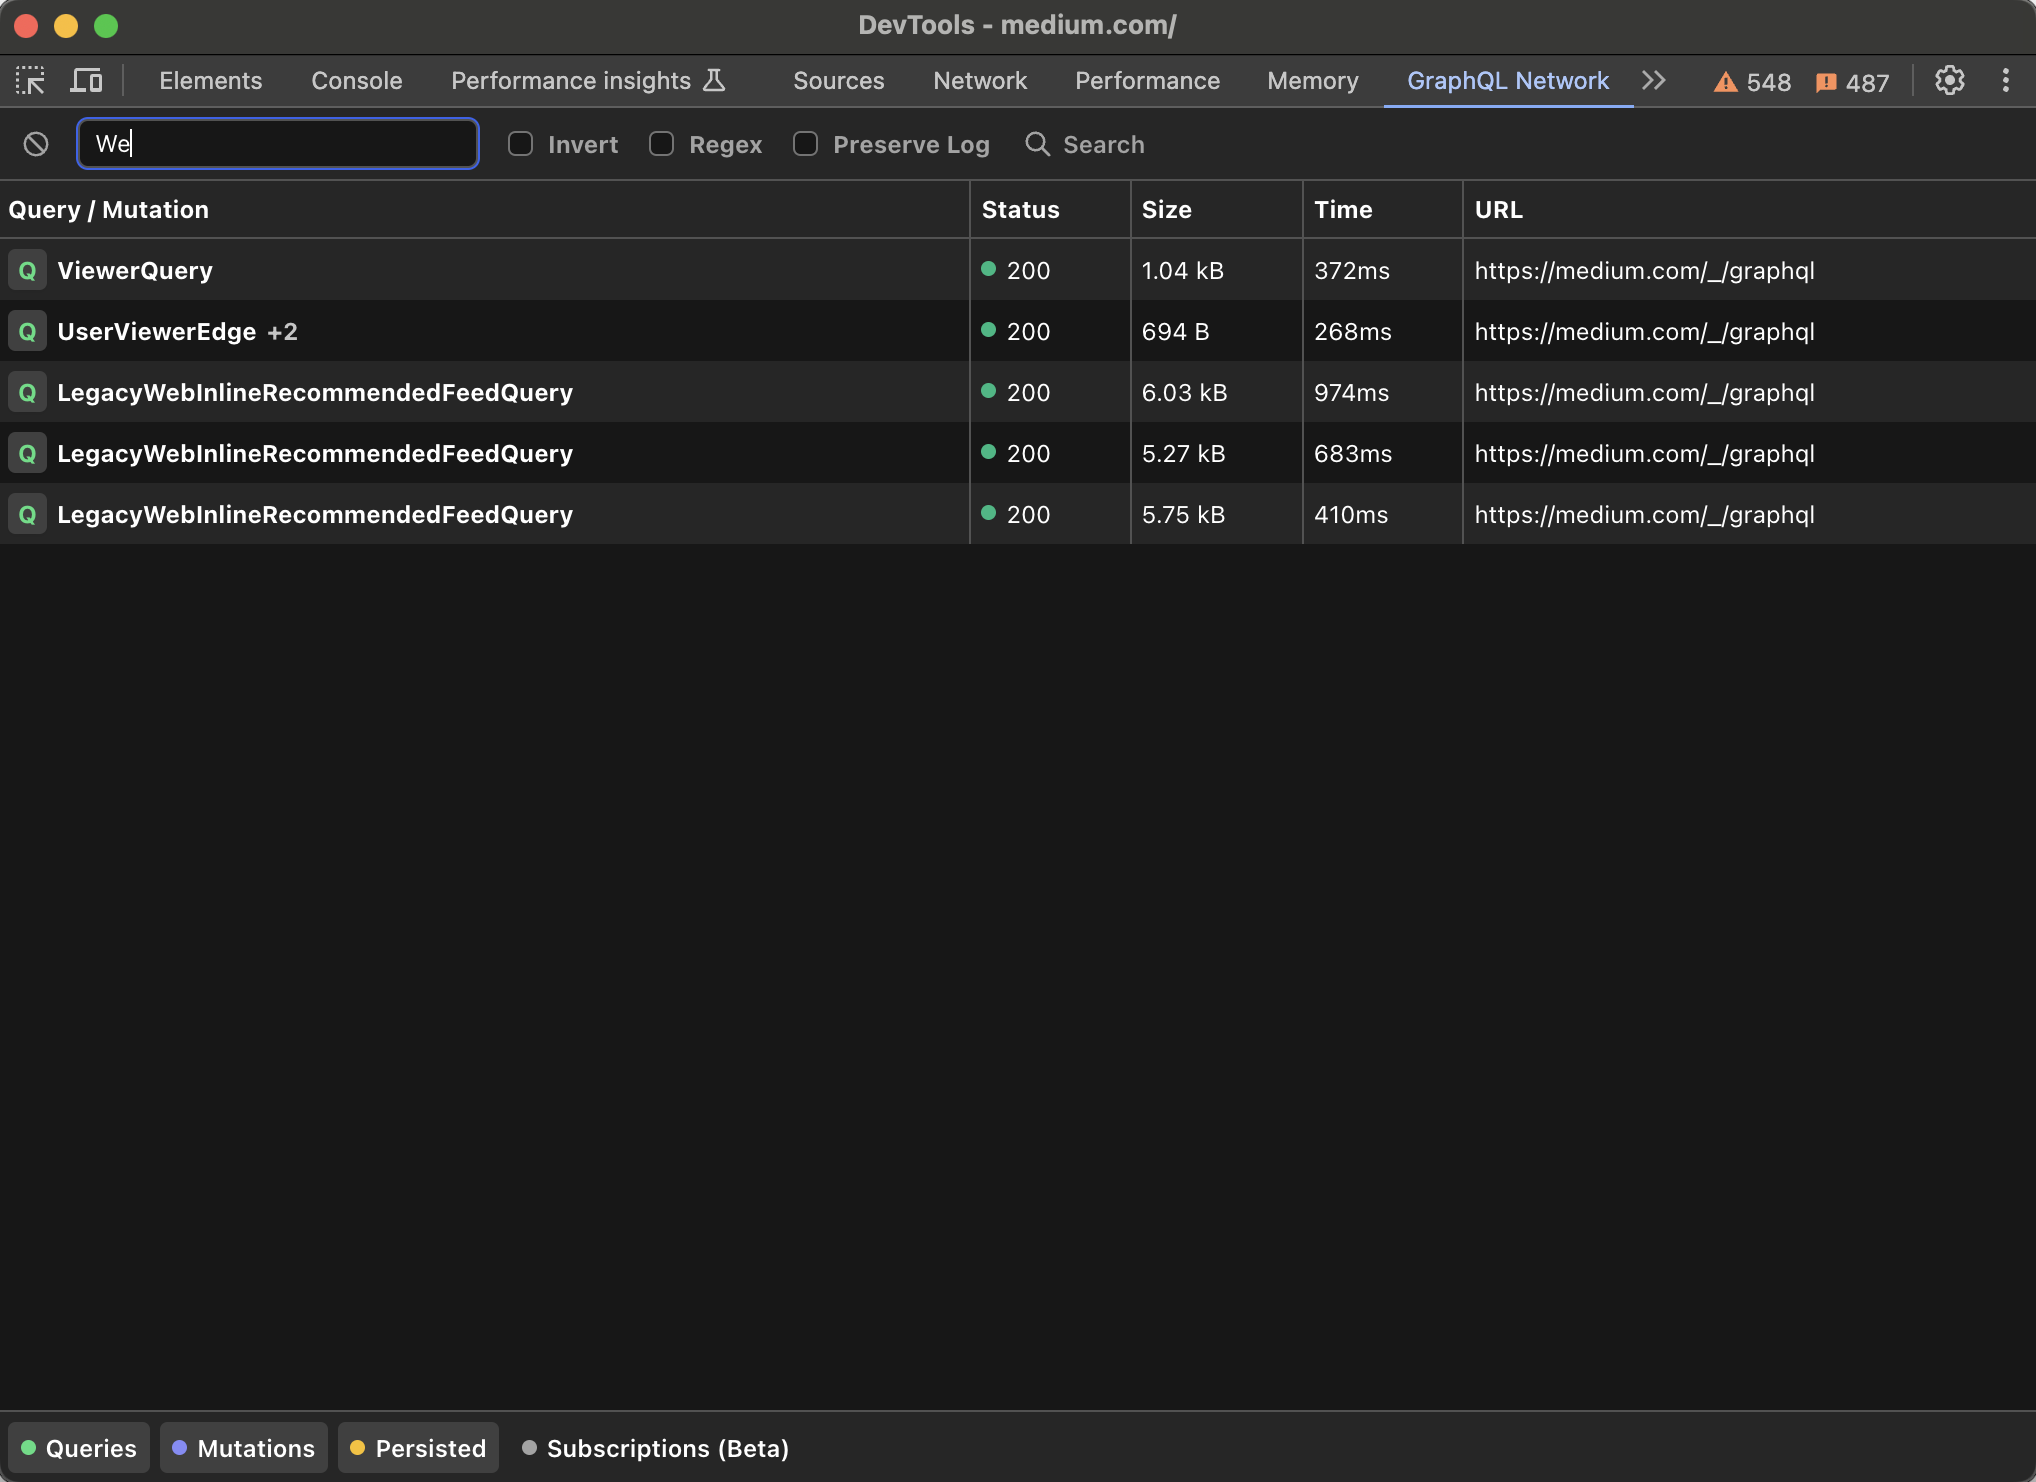
Basic filtering is available via the search bar in the header. This filters based on the displayed query name.
You can both invert the filter, and filter using regex syntax by checking the respective boxes.
Full-text search
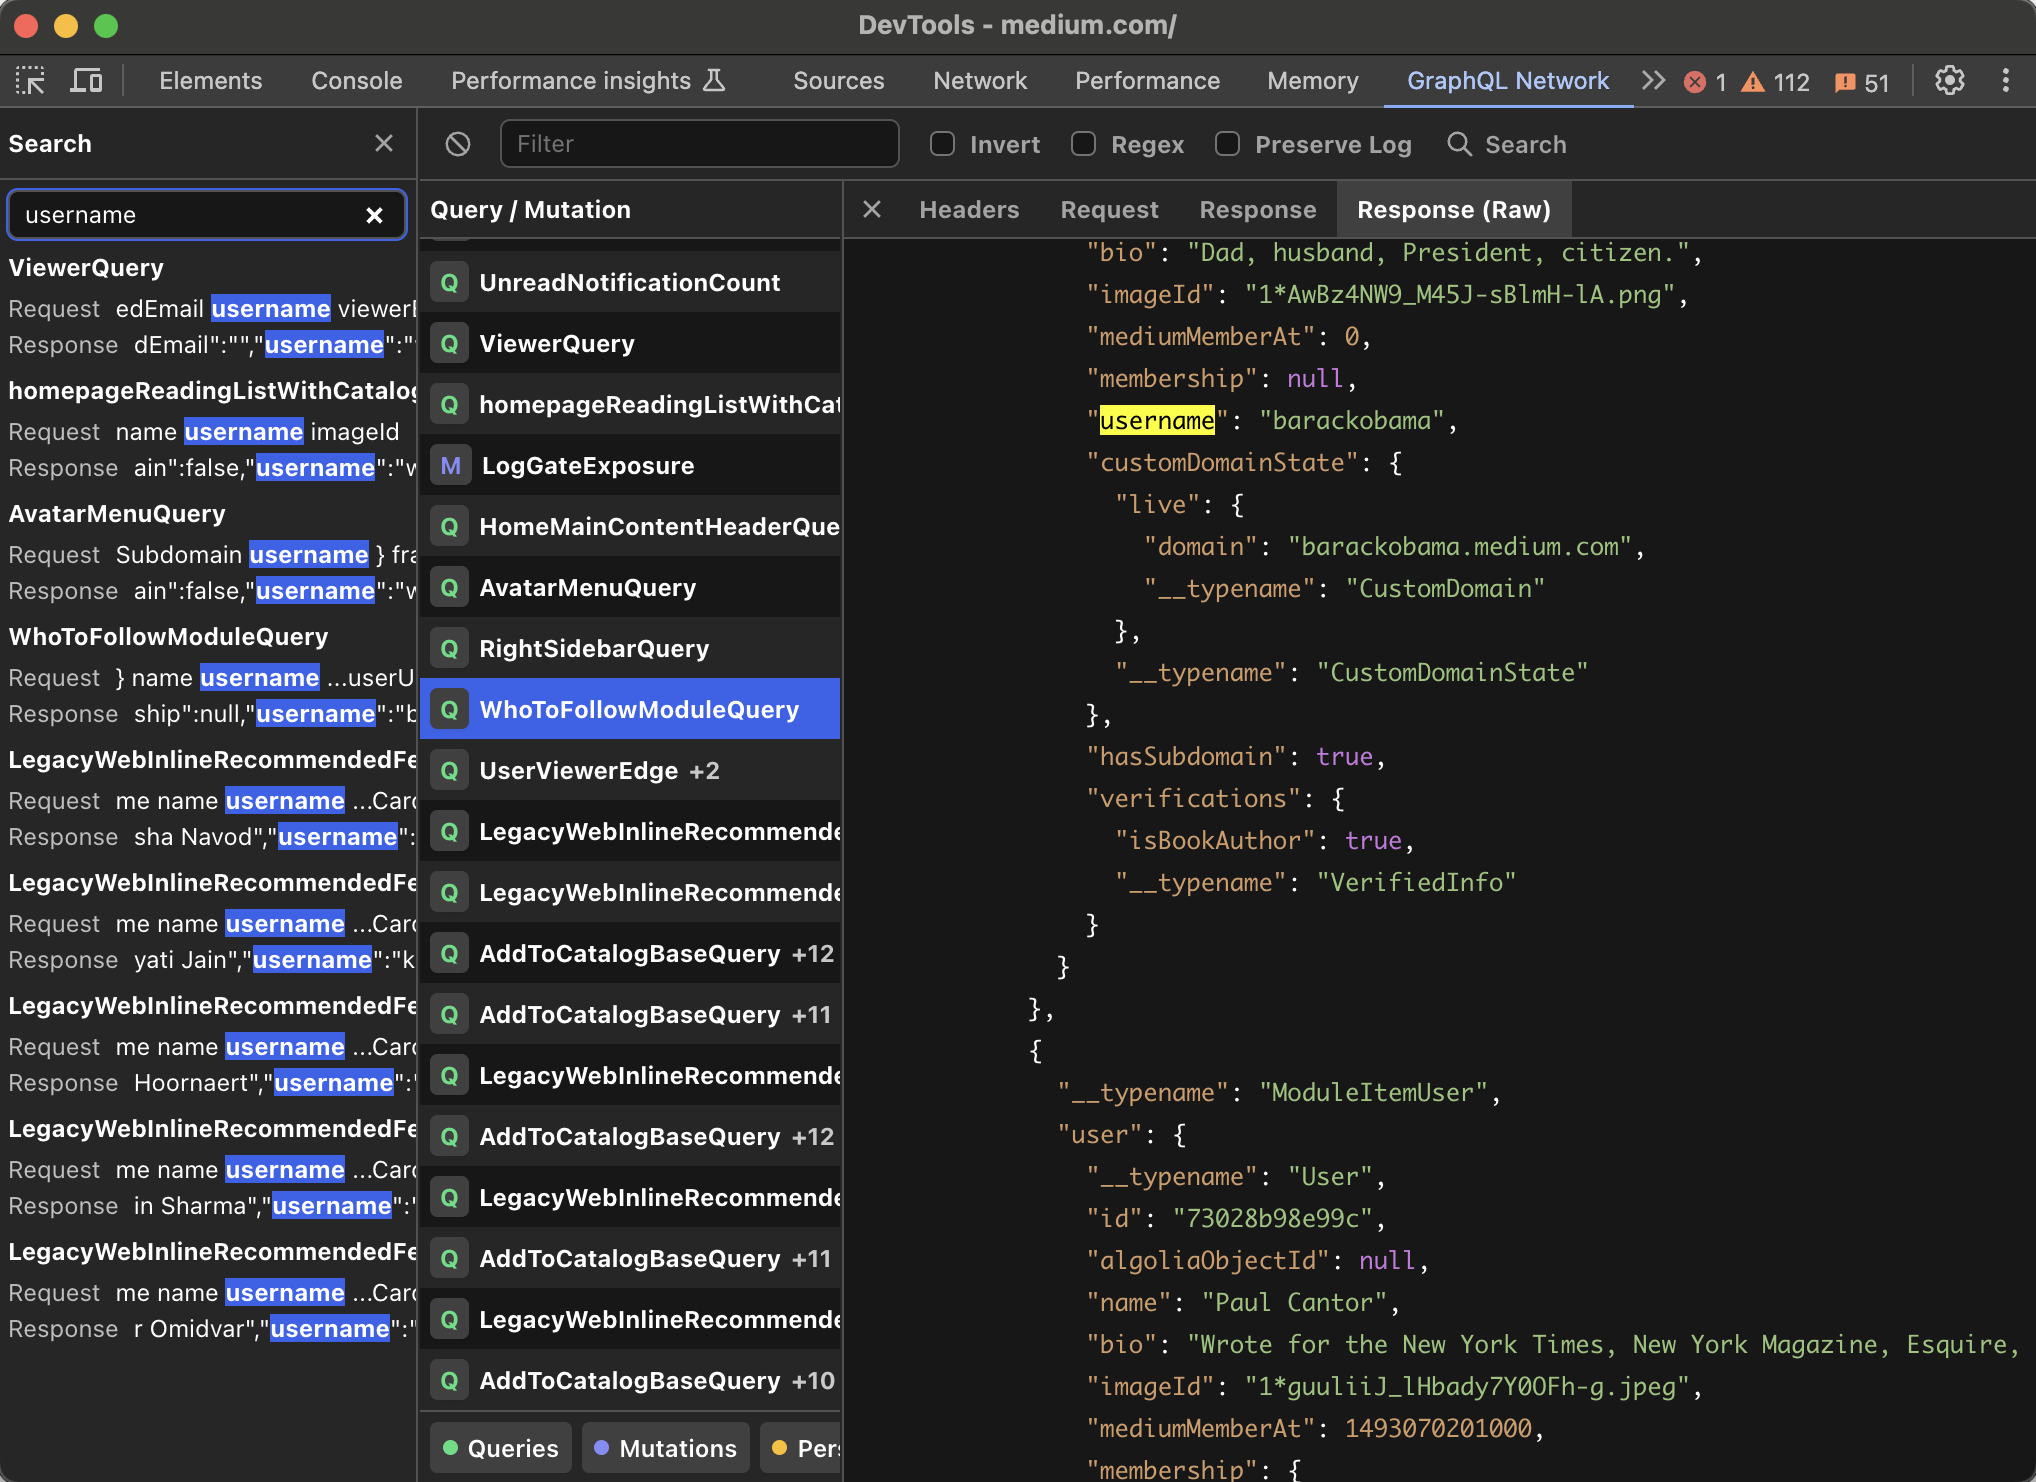
To search beyond just the query name click the "Search" button in the header, or press Cmd + F.
This will open a search panel which covers the request, response and headers. Matched search-queries will be highlighted in yellow.
Parsing JSON Web Tokens
In the headers panel, if any header is a standard JWT you can double click to decode it. The decoded value will also be copied to your clipboard.
Exporting requests
Exporting requests provides extra functionality such as re-running or sharing. The process of exporting is local to your machine, data will not leave your machine unless you explicity click Save on Graph Dev.
Once a request is saved on Graph Dev, you can generate a link to share with your team.
Stay in the loop
Get weekly tips and resources to help you build and launch faster.